Project Details
Brief / Problem
Lloyds Banking Group commissioned us at Wipro Digital to help them improve their customers' financial health. A previous digital prompt we had run identified a large customer appetite for finding out more about their financial health - 95% of which were wishing to receive a financial health score.
Our challenge at WD was to create and test a Financial Health Check tool with real data and at a nationwide scale, to help customers identify pain points in their financial situations and become more financially healthy, whilst capturing results and iterating our prototype based on feedback - all this in 7 weeks!
Role & tools
- ・Sketching
- ・Wireframing
- ・Sketch, Invision
- ・Prototyping
- ・HTML5, CSS, React
- ・Data Visualisation
- ・User testing
- ・User survey
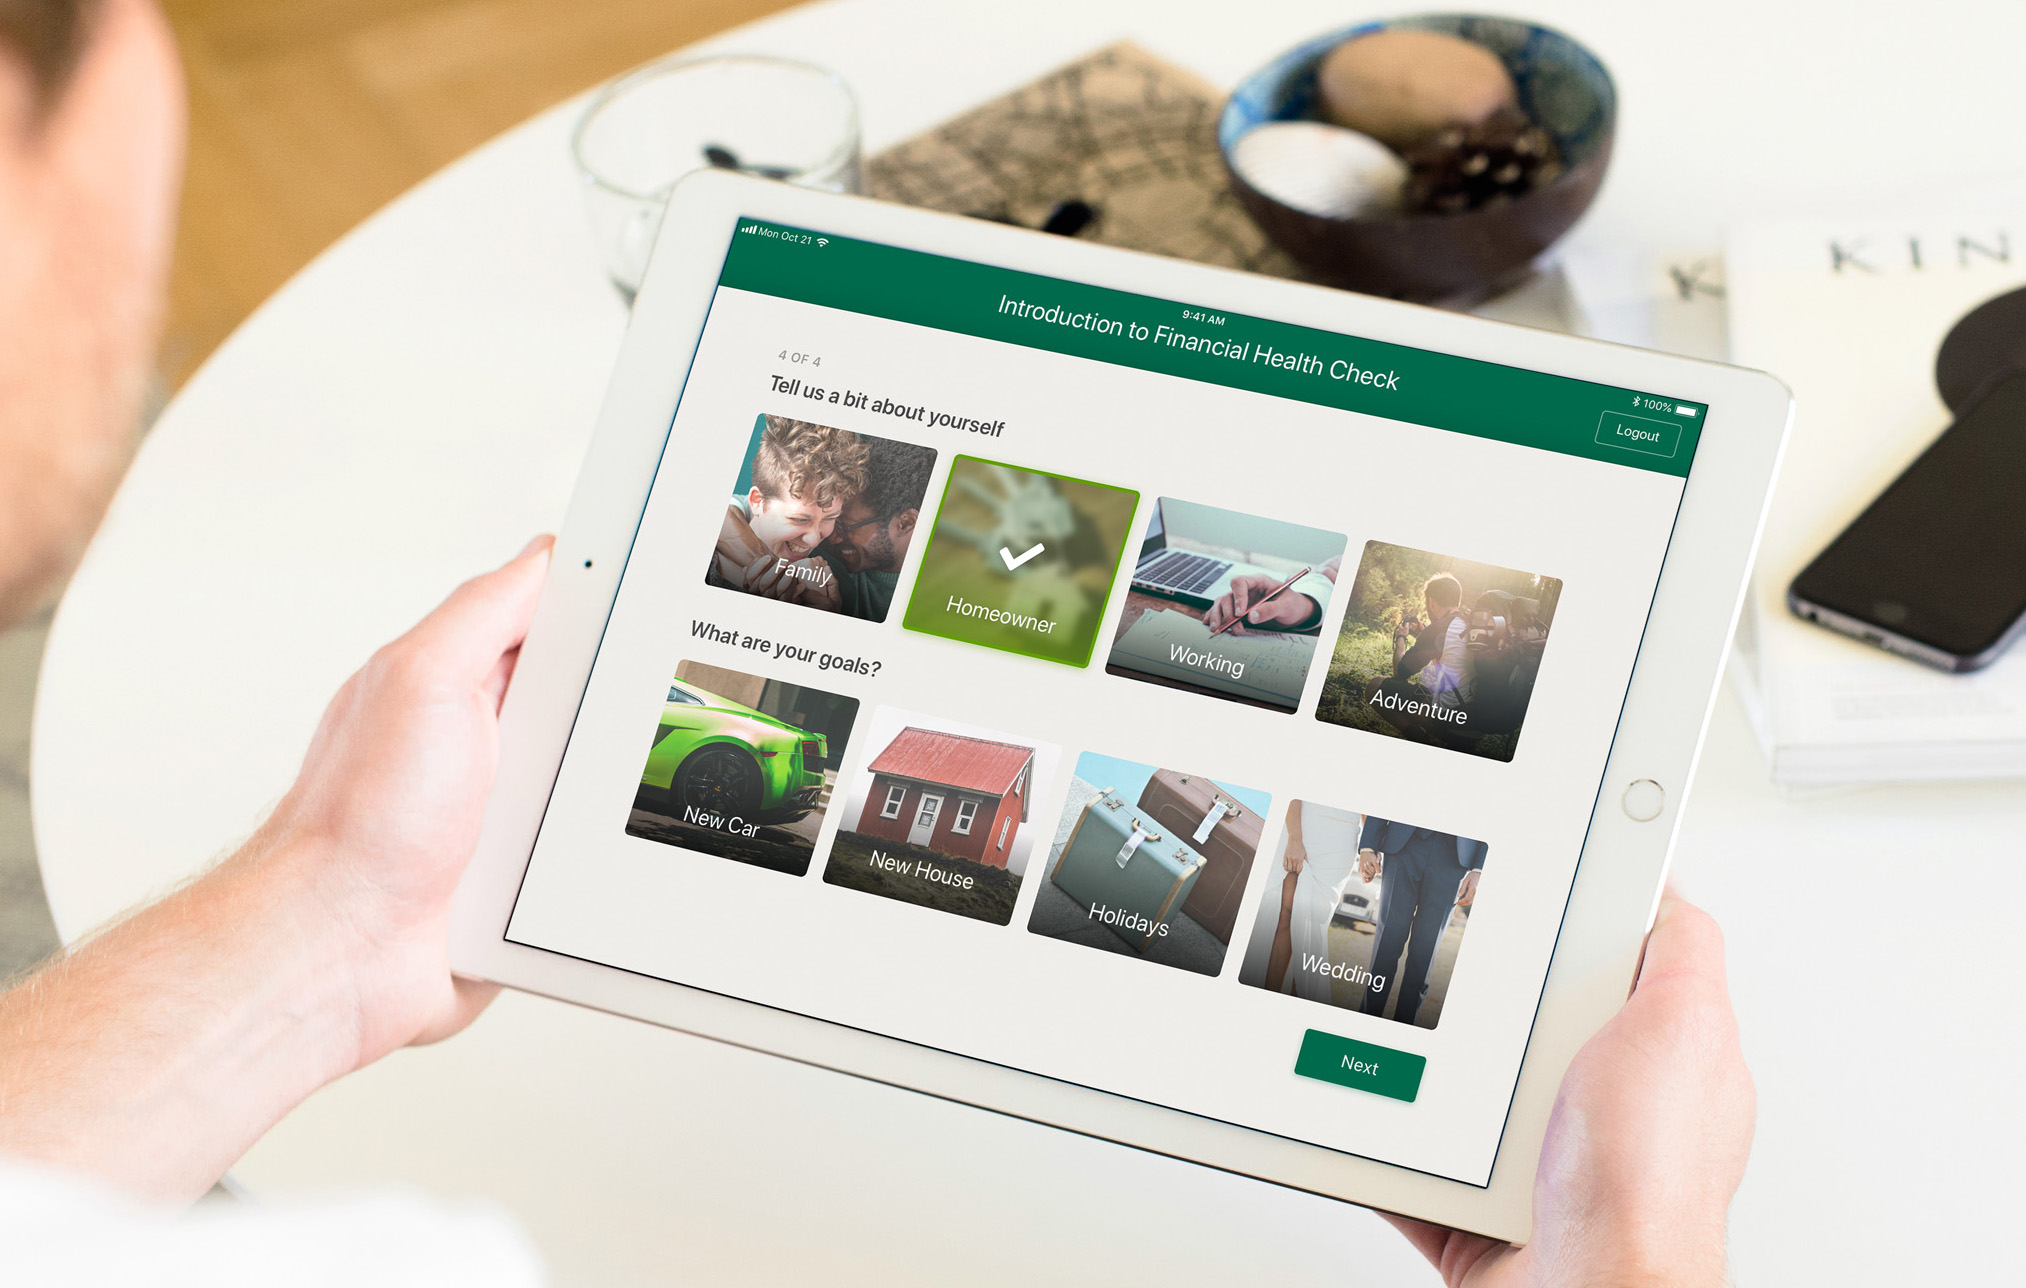
Above: a step from the prototype onboarding flow
Process
For this project we followed a lean in-house "Cycle 7" approach, essentially a 1-week research phase followed by 3x2 weeks sprints, ultimately leading to a nationwide pilot test. I was part of an agile squad of Creative Technologists and a Design researcher, and was involved from the initial kick-off workshop with the client right until the end of the engagement.
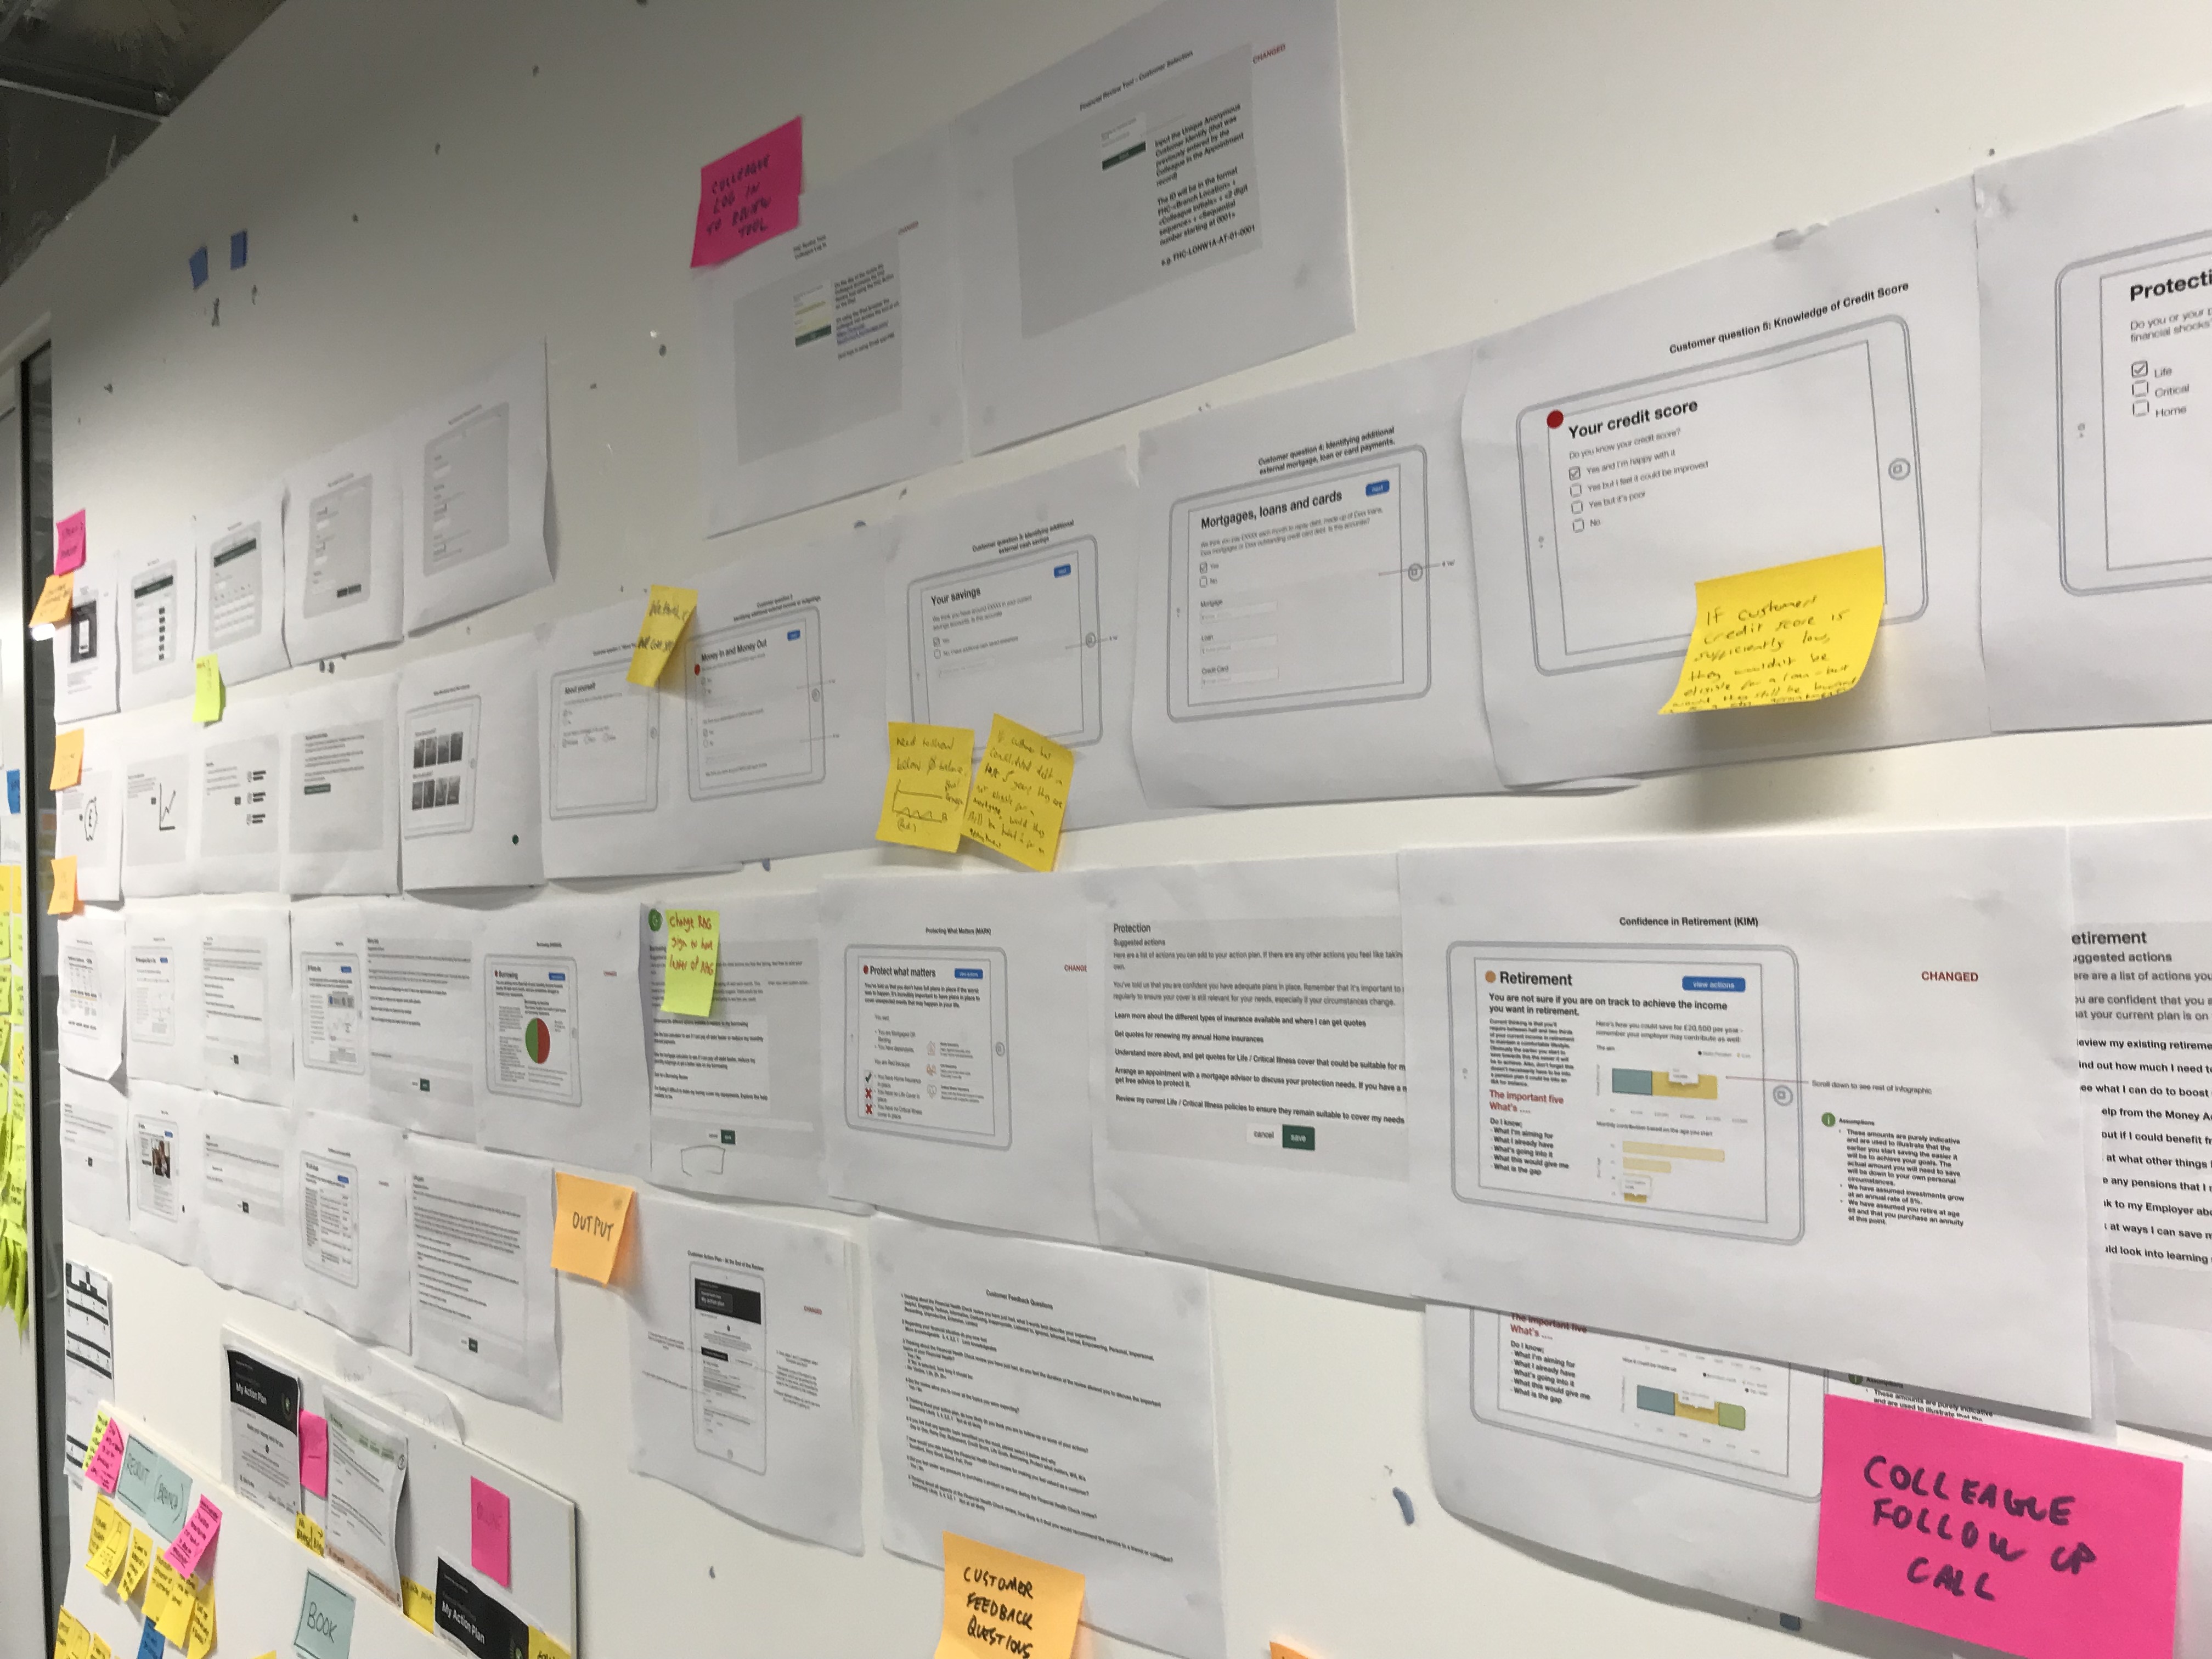
During the initial research phase we carried out a number of research activities as a group, sharing the same office space with the client to gain a deep understanding of the client's target audiences, goals, business requirements and start prioritising the work for each upcoming sprint.
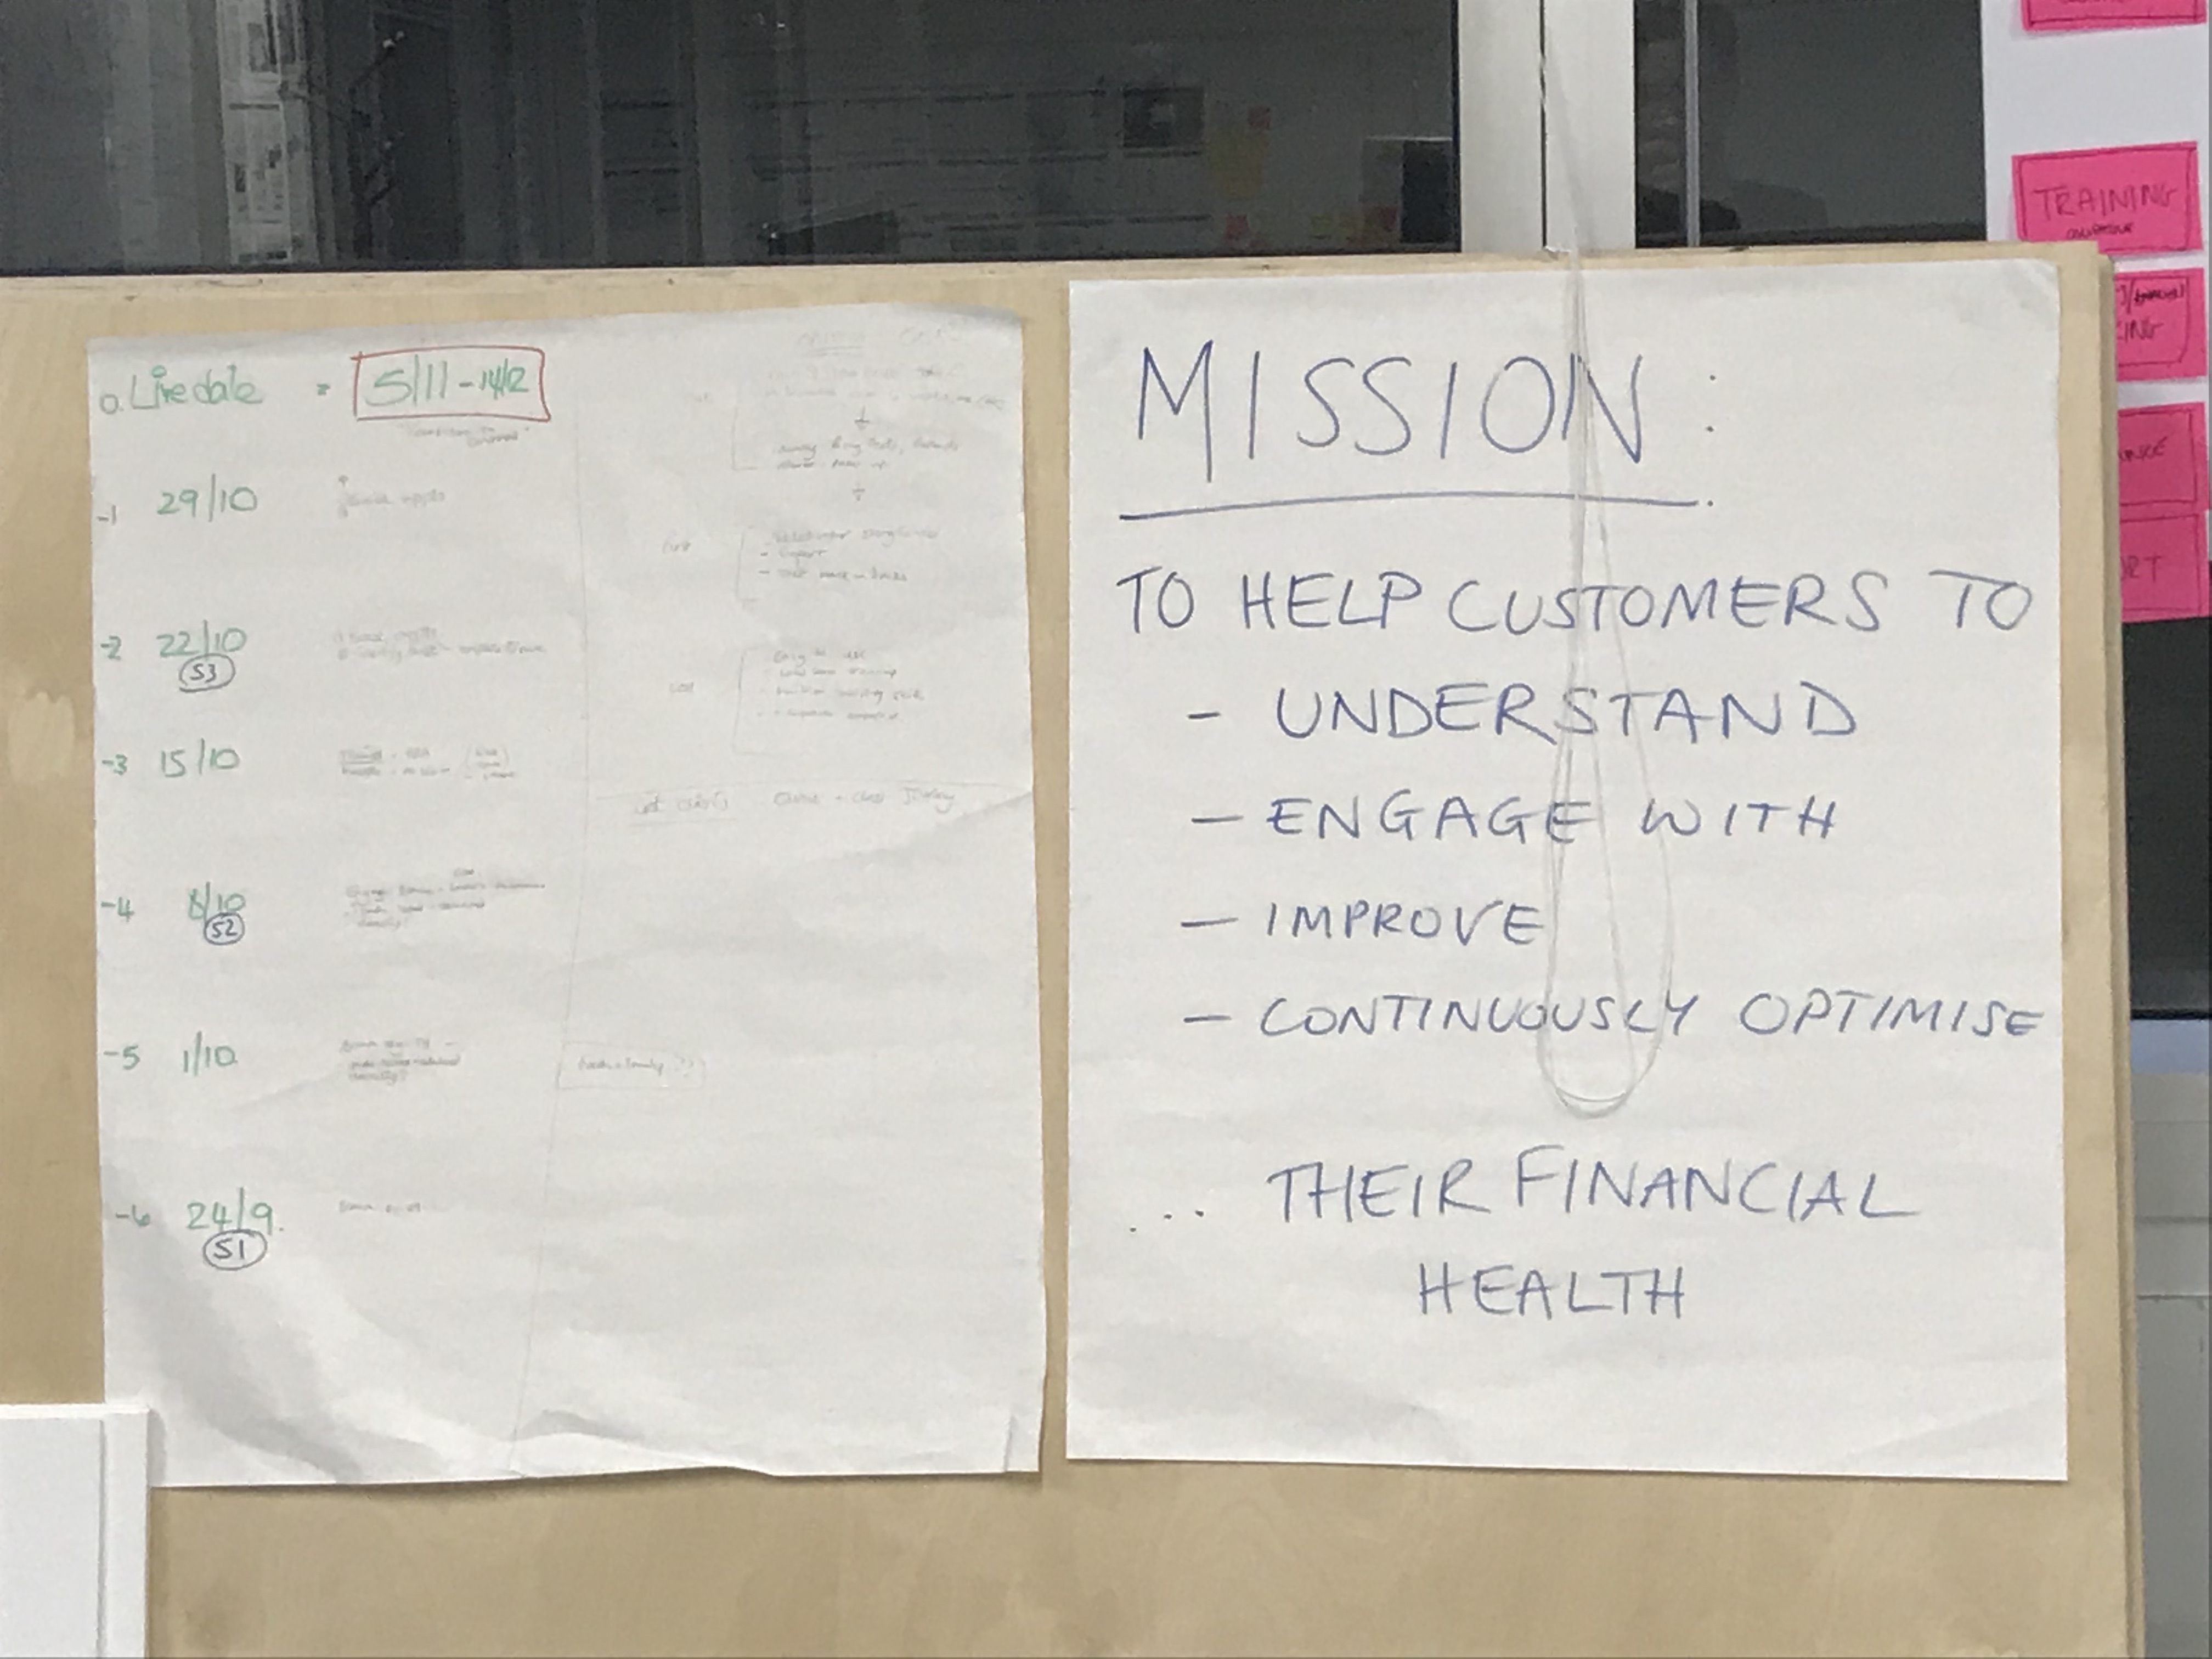
Above: our mission statement
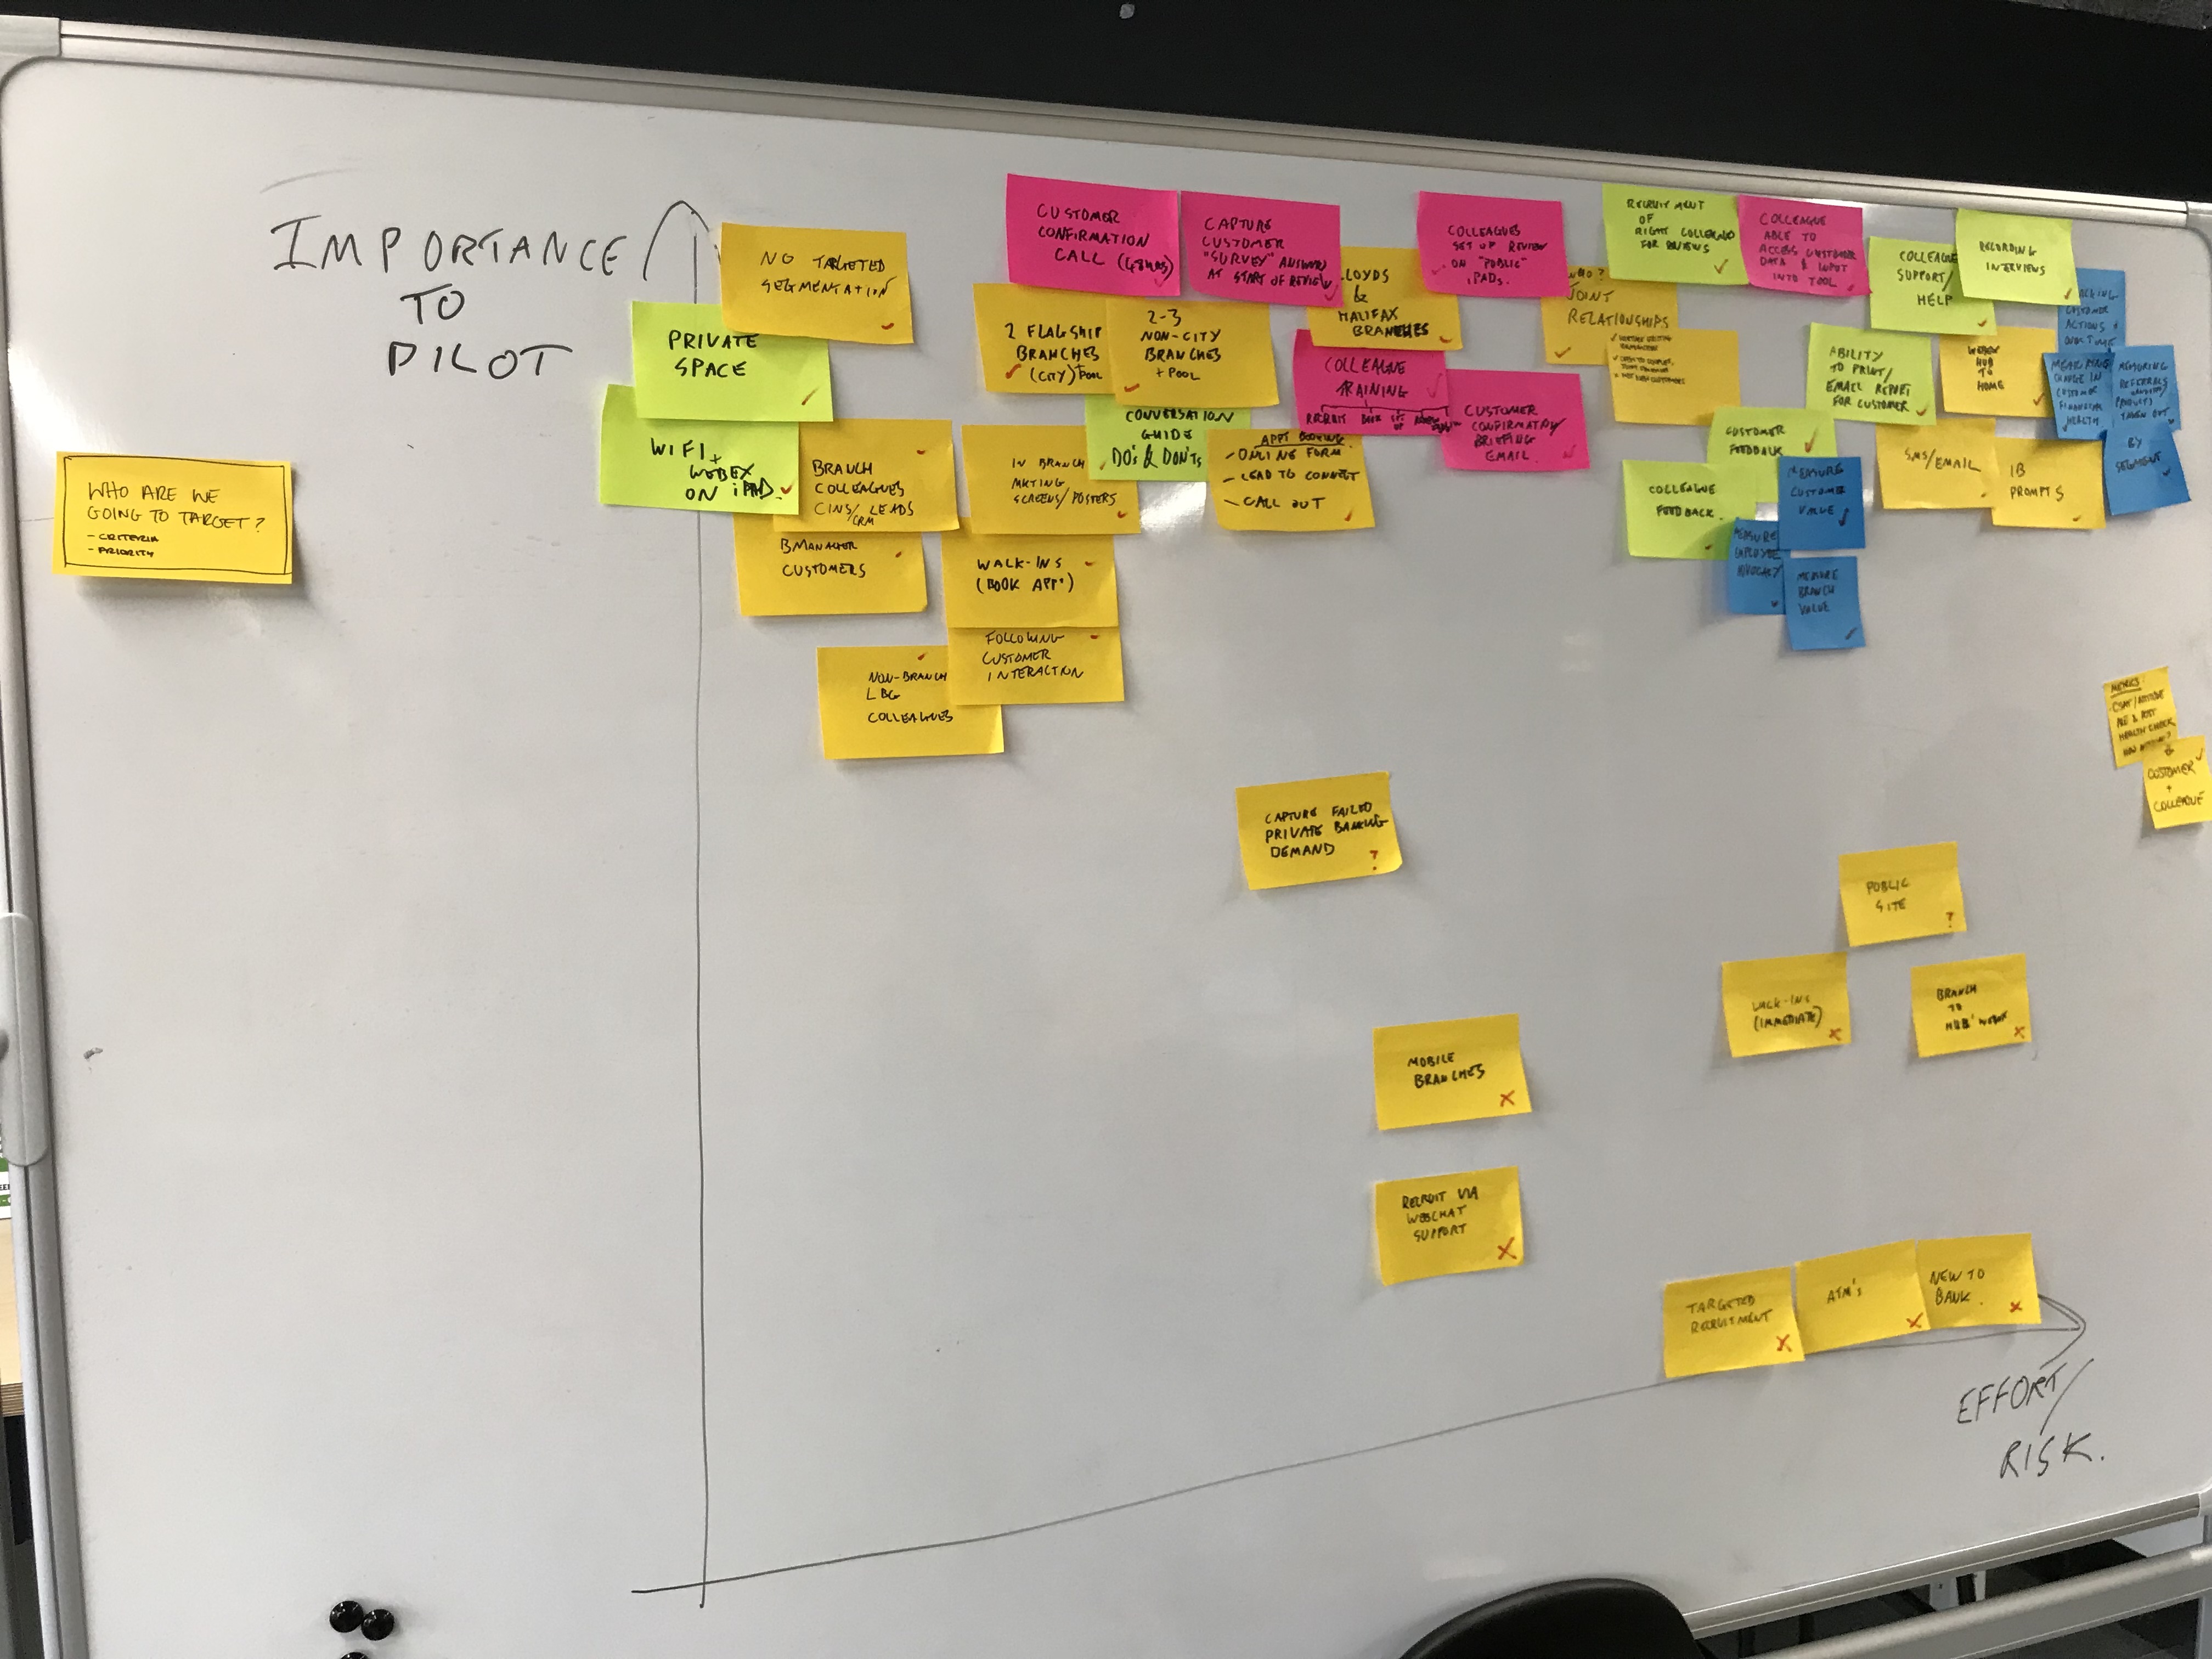
Above: prioritisation
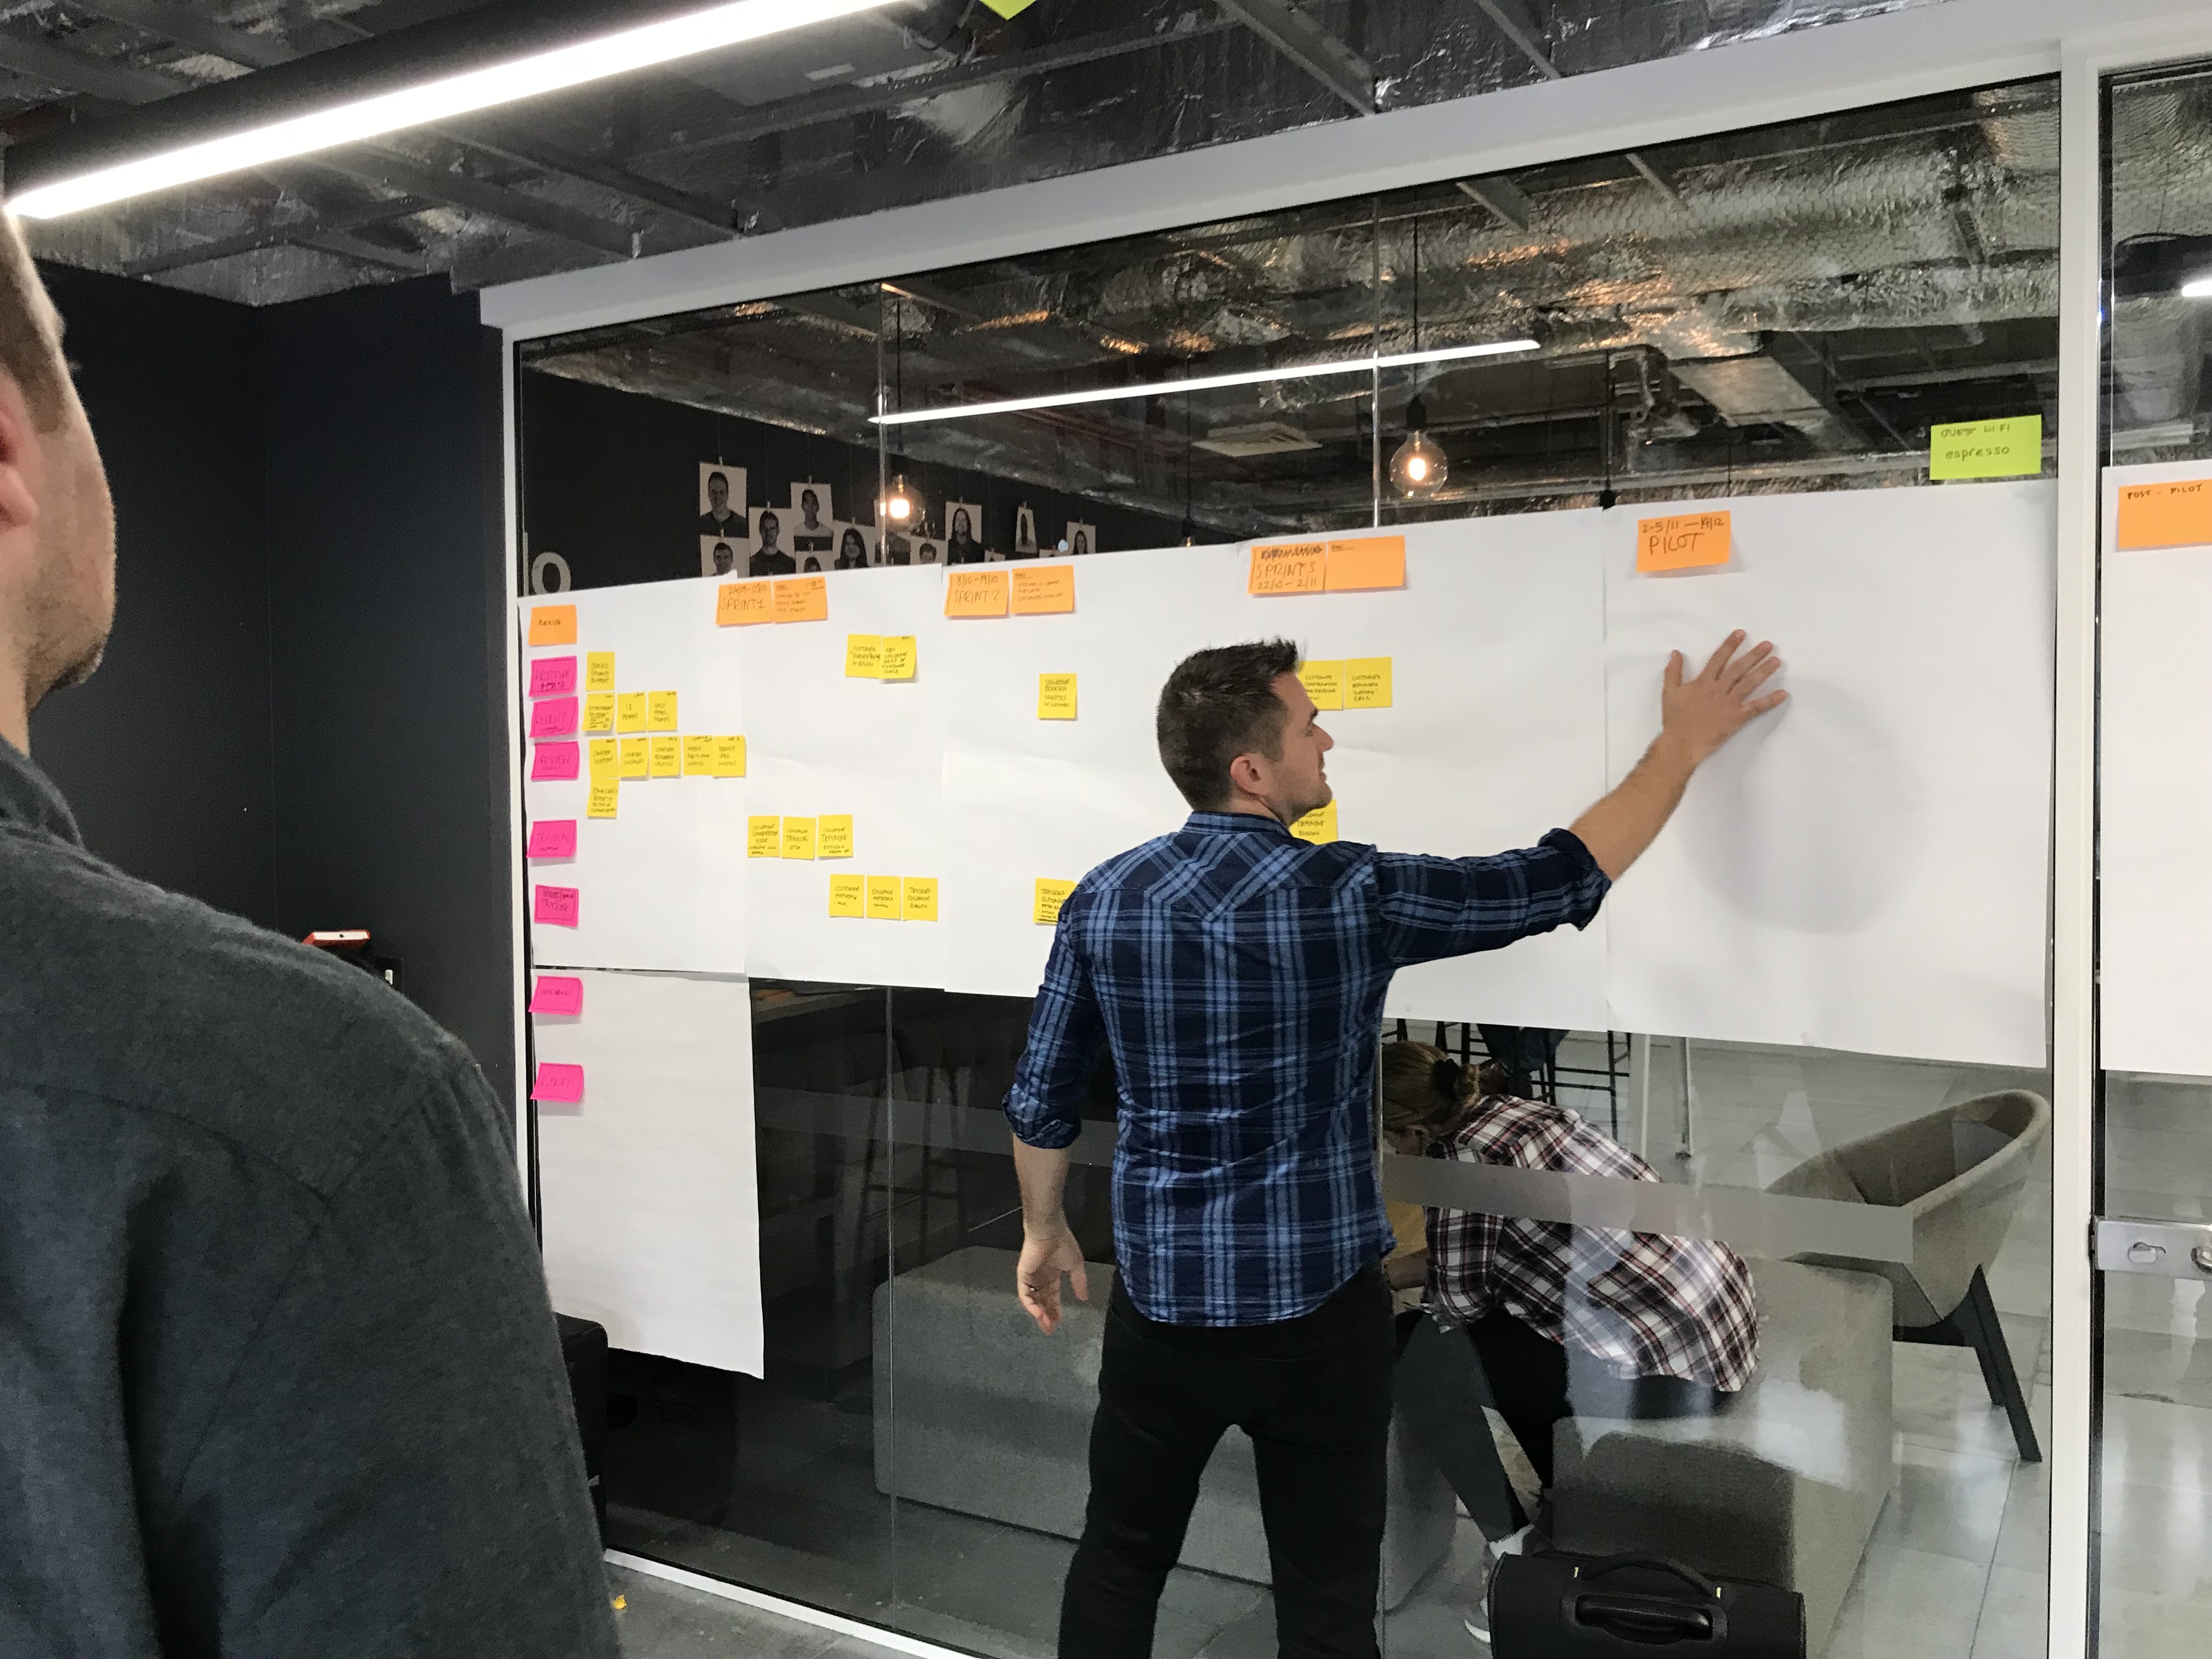
Above: sprint planning
As Creative Techs we were able to wear various hats and complement each others' strengths: in this instance I got mostly involved in the UX/UI design and prototyping whilst another Creative Tech focussed on the engineering and back-end aspects - still working closely together and helping each other out when needed.
I was able to work on the initial sketches and wireframes and obtain the client's approval for them, seeking early validation through user testing at the end of the first sprint, then gradually translate those into higher fidelity screens in Sketch and Invision, iterating using feedback from Lloyds stakeholders, in-branch staff and customers alike.
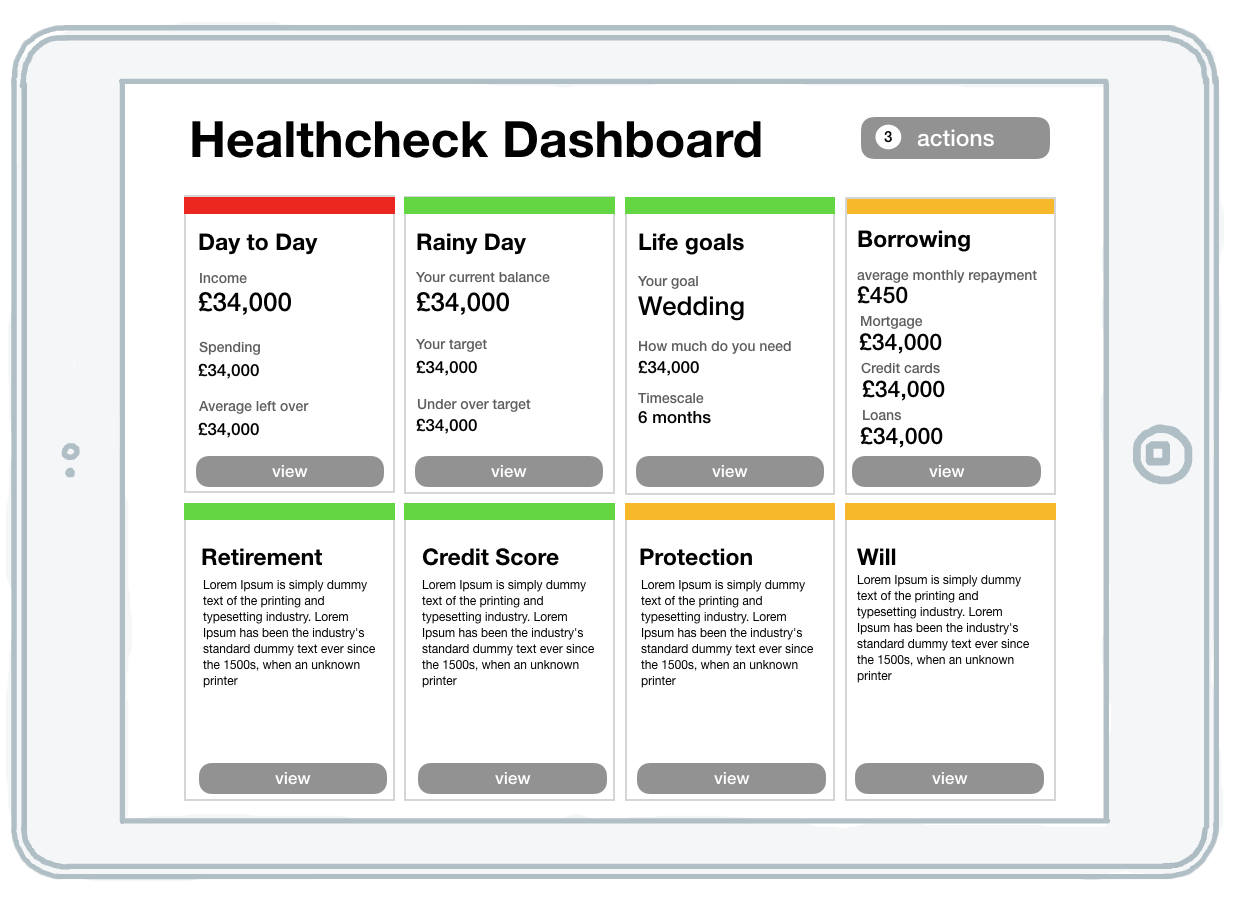
Above: Dashboard wireframe
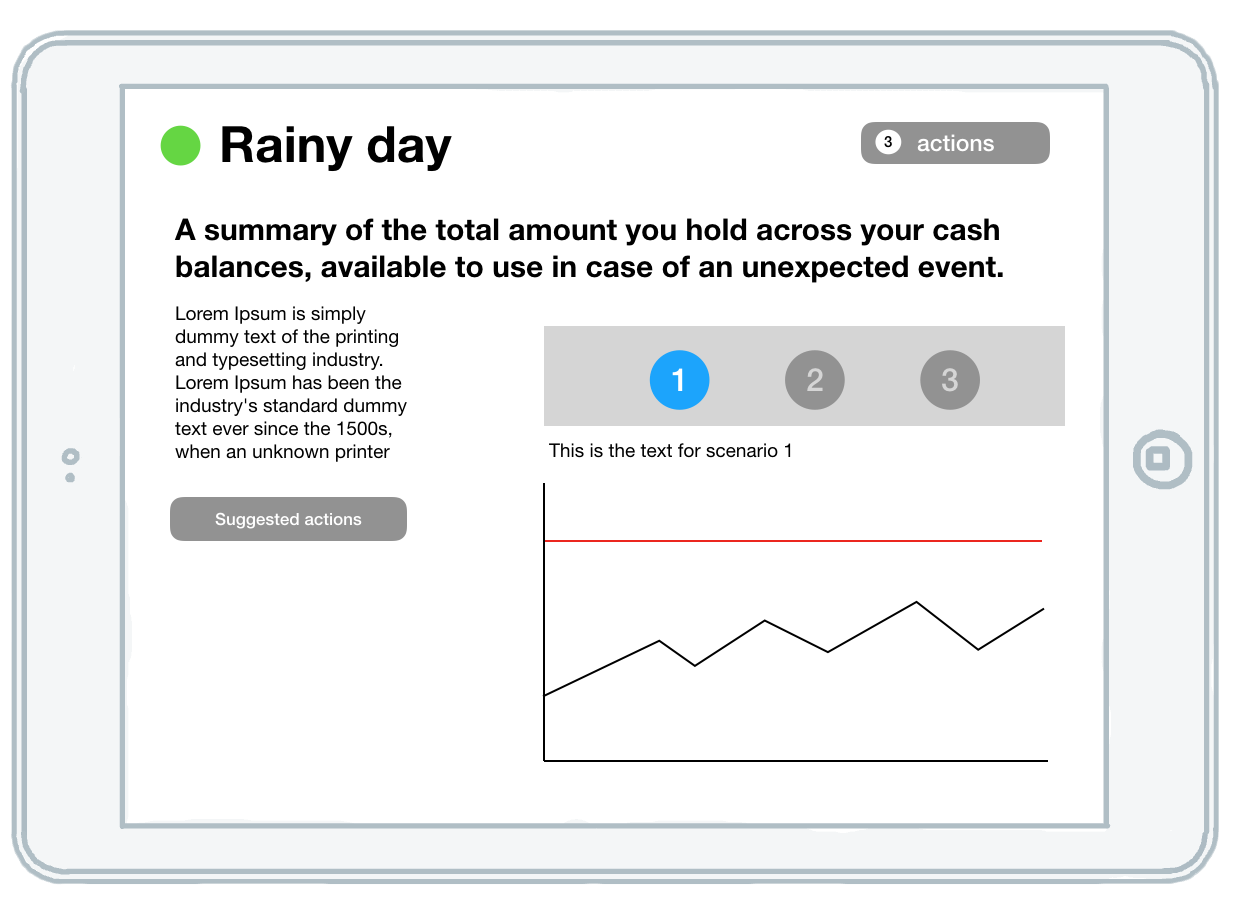
Above: Rainy Day visualisation wireframe
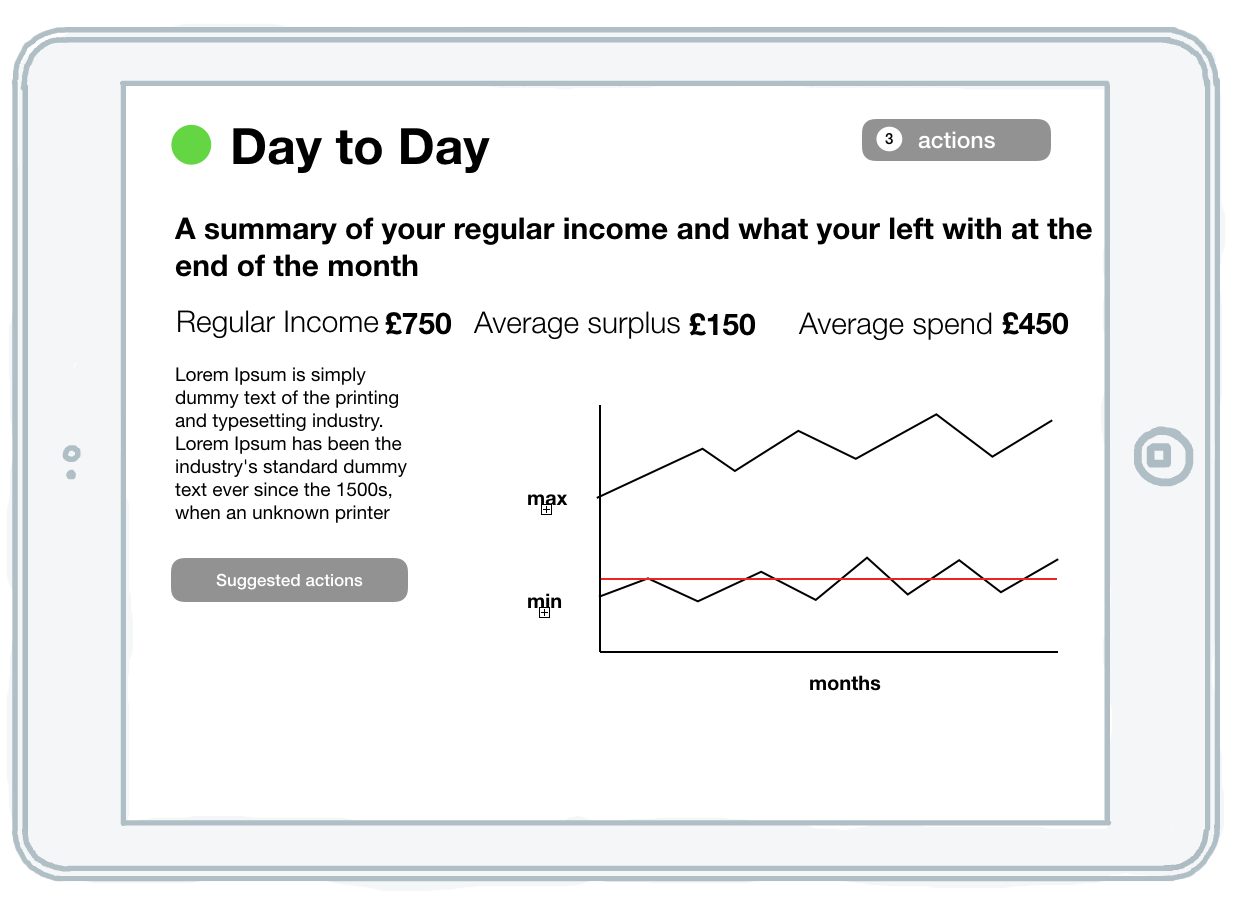
Above: Day to Day visualisation wireframe
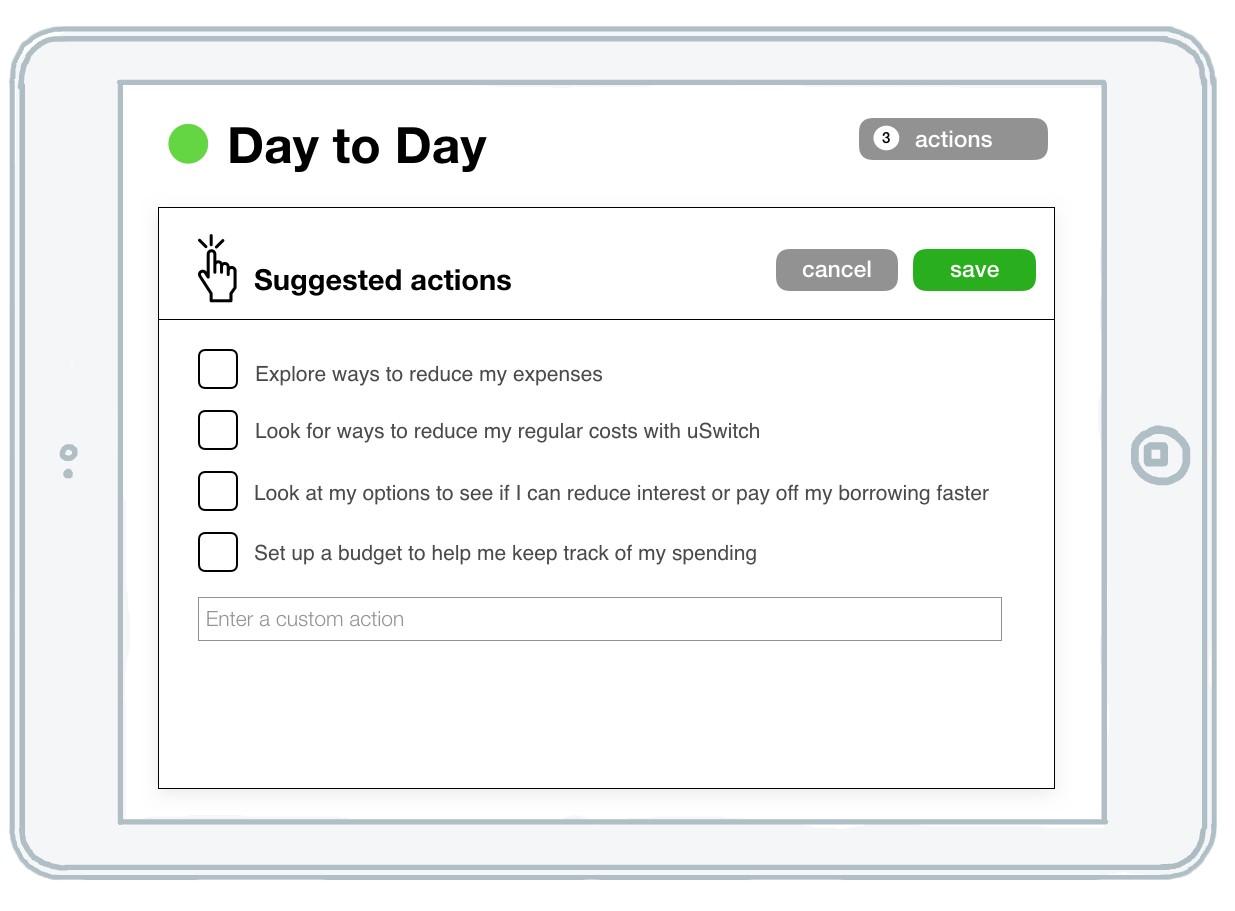
Above: Day to Day actions wireframe
I also had the opportunity to learn both React and Angular - due to separate tech requirements for the customer-facing side of the prototype and in-branch colleague side - by working on some of the logic behind the financial scoring and engineering aspects for the prototype.
Above: low-fi iterations
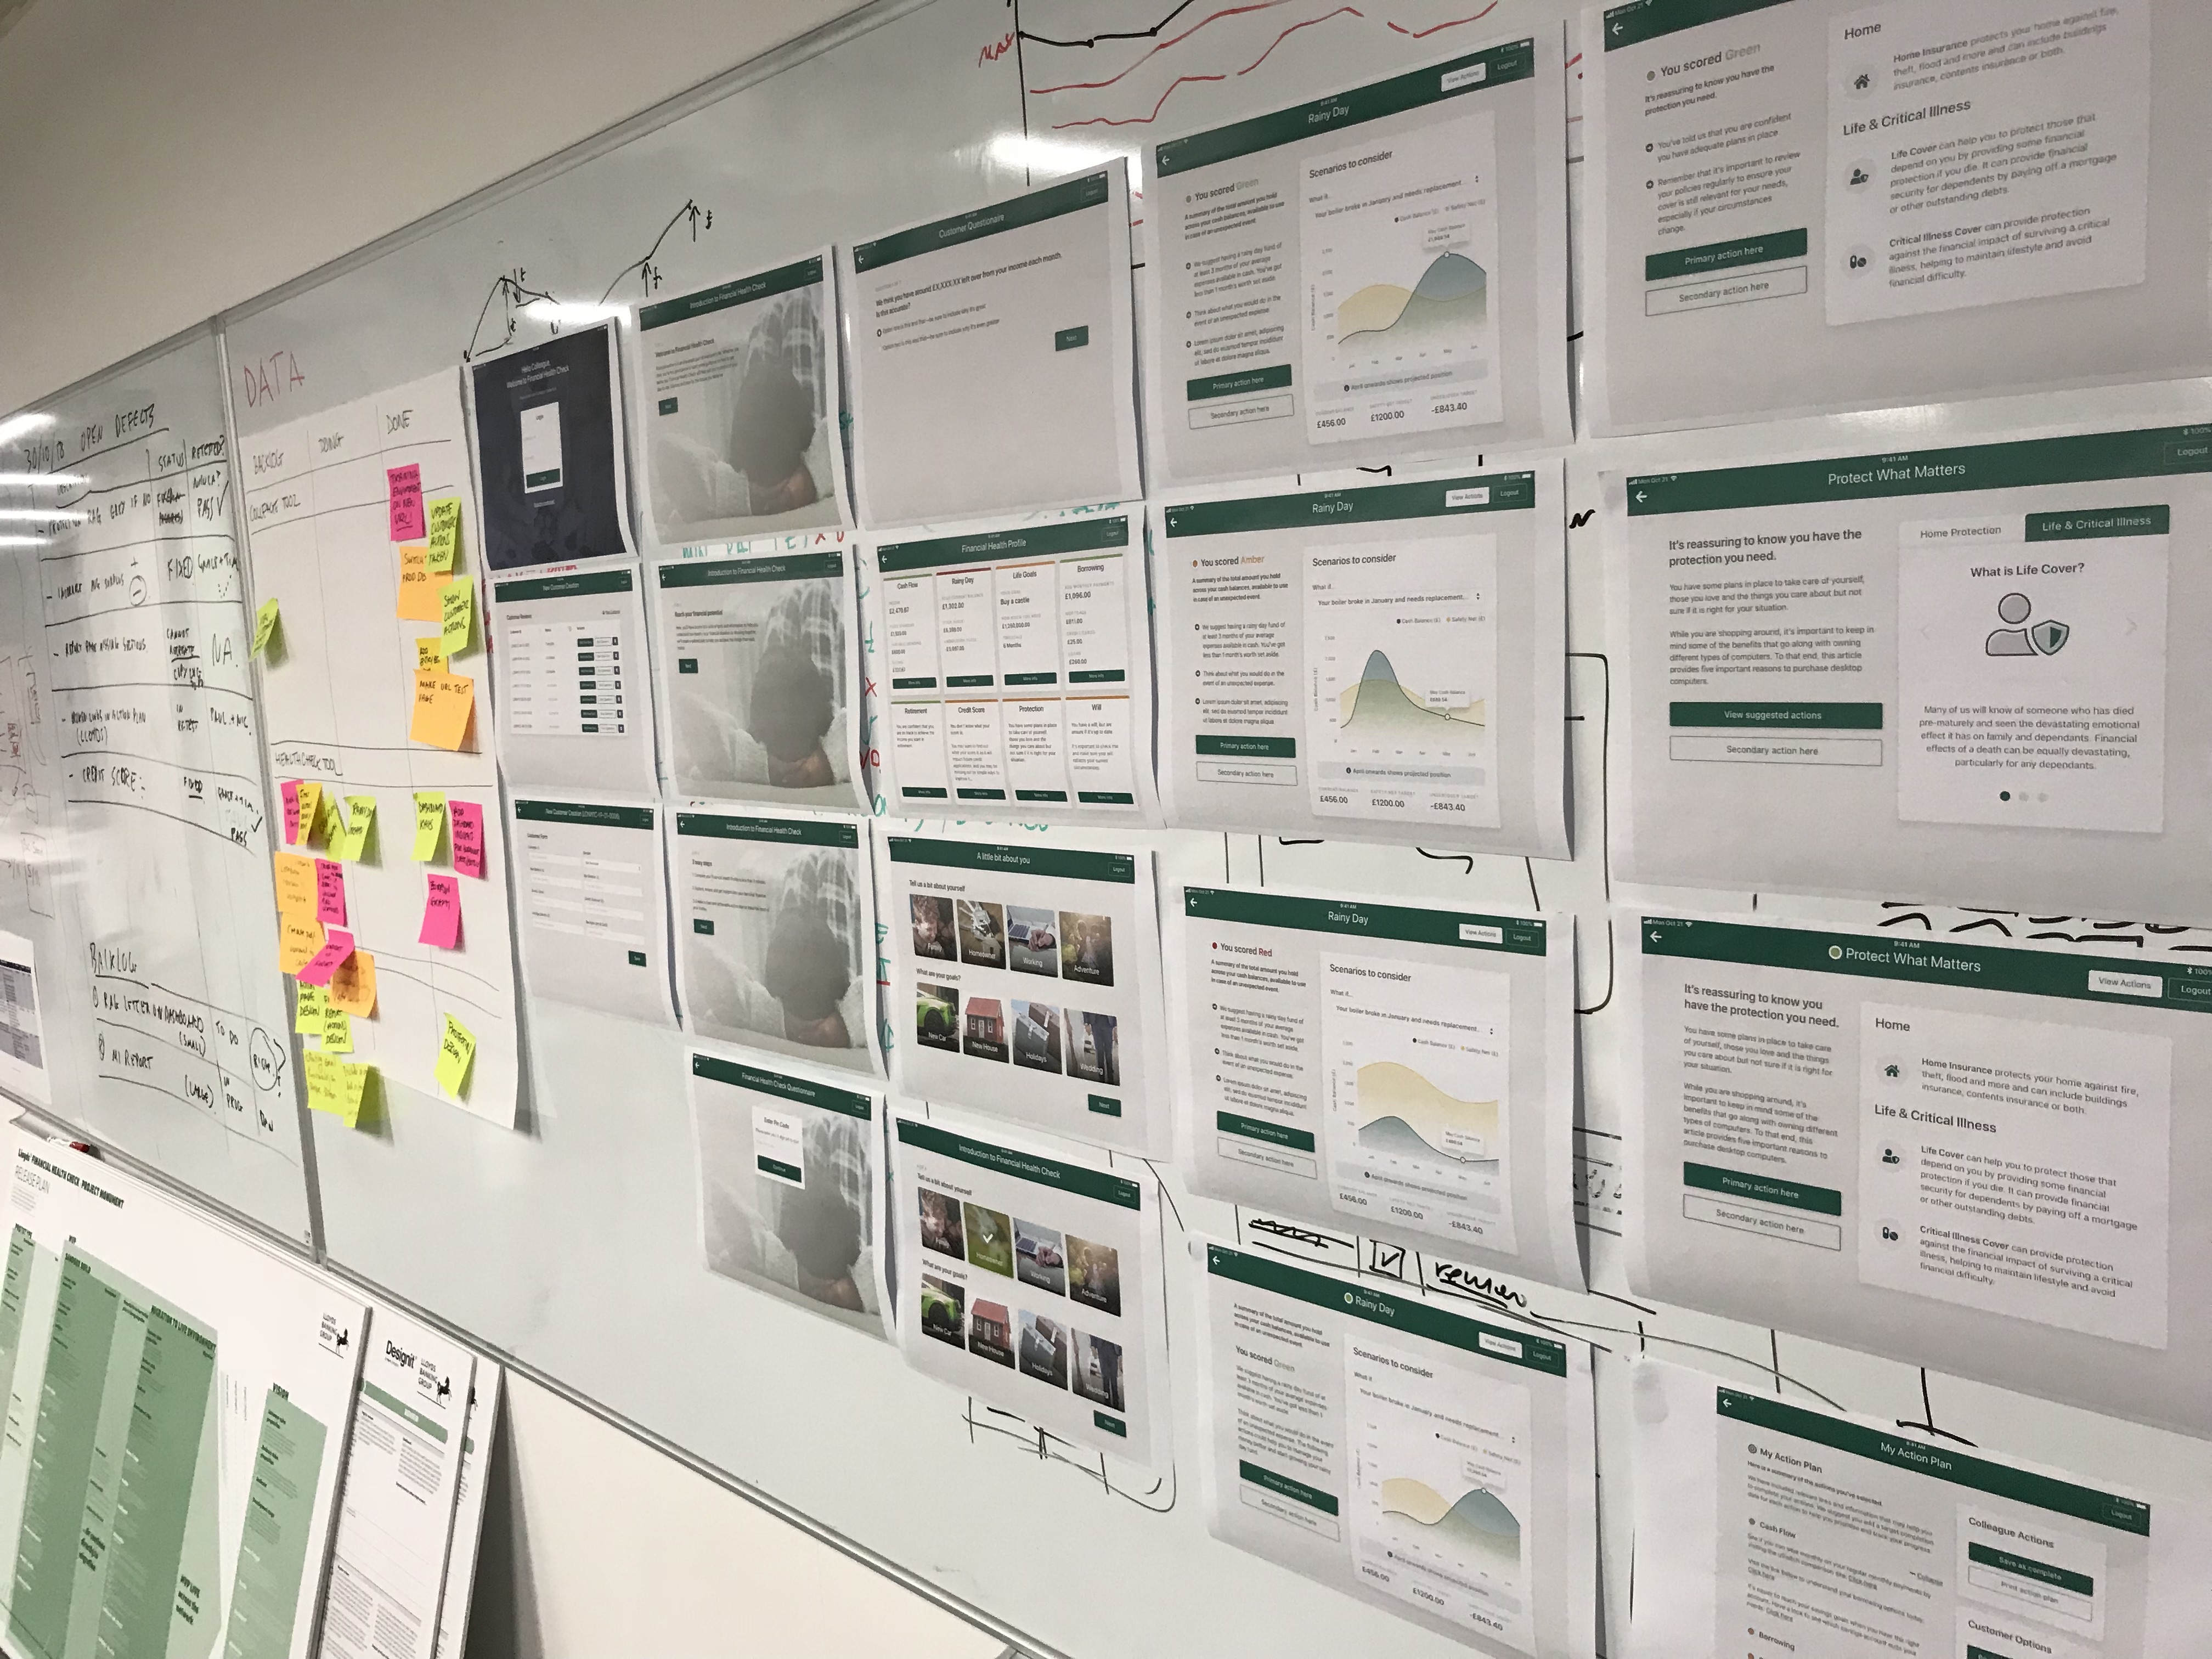
Above: scaling up fidelity
Above: an early iteration of prototype, fully functional with animated customer data visualisation
Outcomes
In just under 2 months we managed to deliver a fully working prototype, using actual customer data that Lloyds Banking Group were able to use in Lloyds and Halifax branches across the nation. I also delivered a seamless implementation of a user survey, which came back with some strong results - 82% of users would be willing to recommend our tool to a friend, 80% considered it to be helpful, and 73% would be extremely or highly likely to follow up on the actions suggested. After a successful pilot our engagement was extended and we were able to carry on working as a part-time support team for another few weeks.
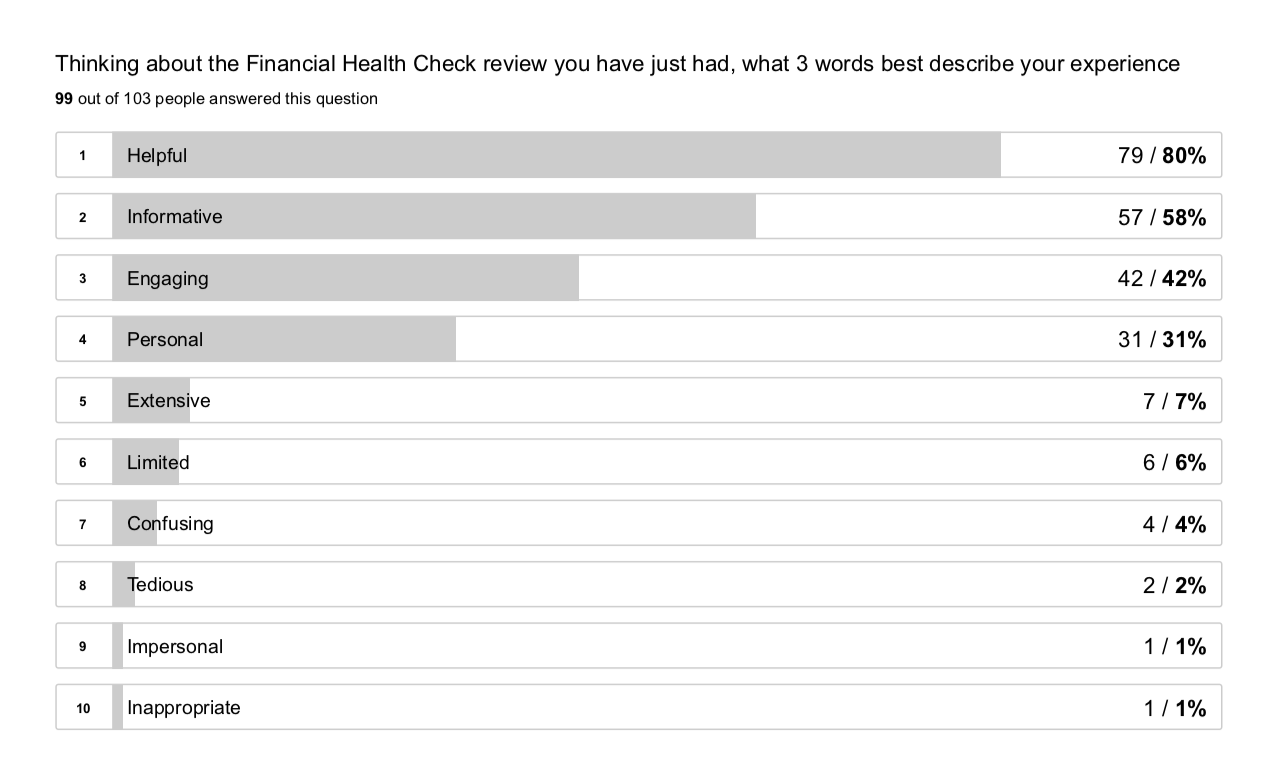
Above: excerpt from user survey report
Due to the short timeframe and with a bit more time, I would have liked to further refine the UI, mainly to address certain inconsistencies between the build and the designs, and I would have liked to carry on with efforts to make the solution as device-agnostic as possible to ensure future scalability.
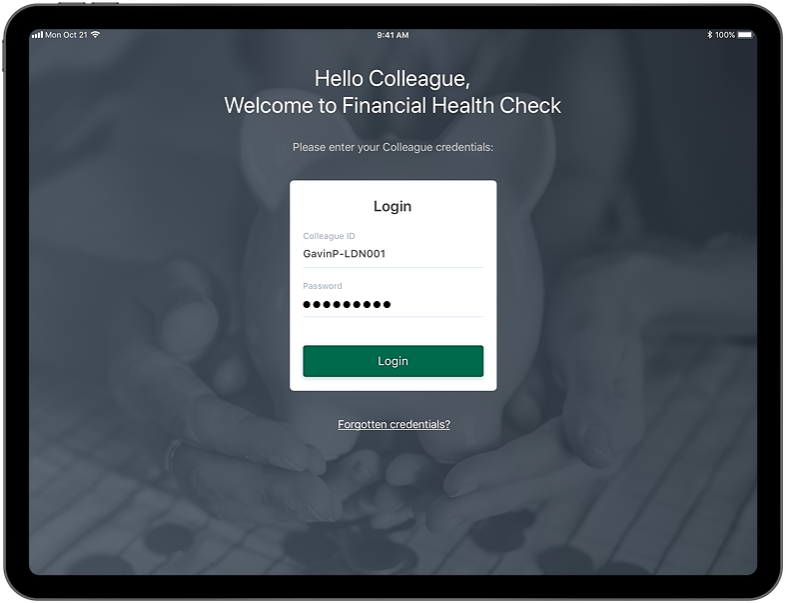
Above: Lloyds staff login screen
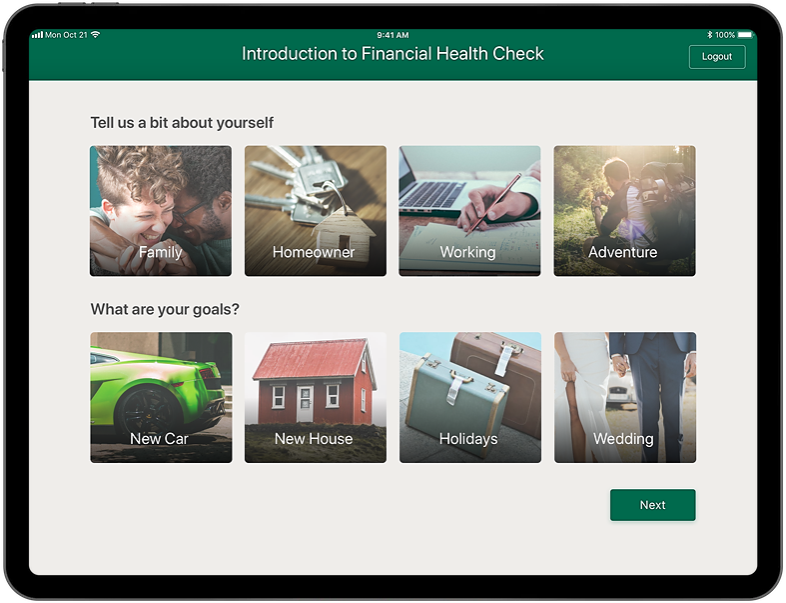
Above: User onboarding screen
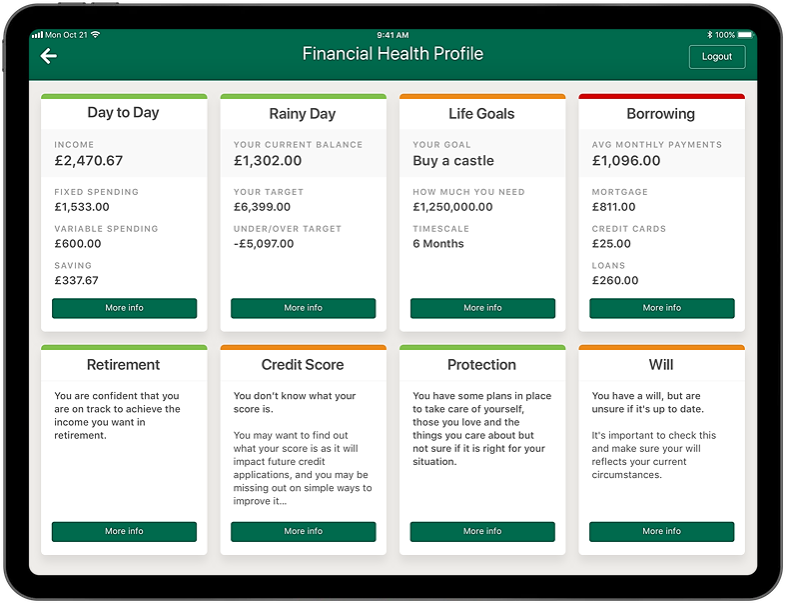
Above: Financial health profile screen
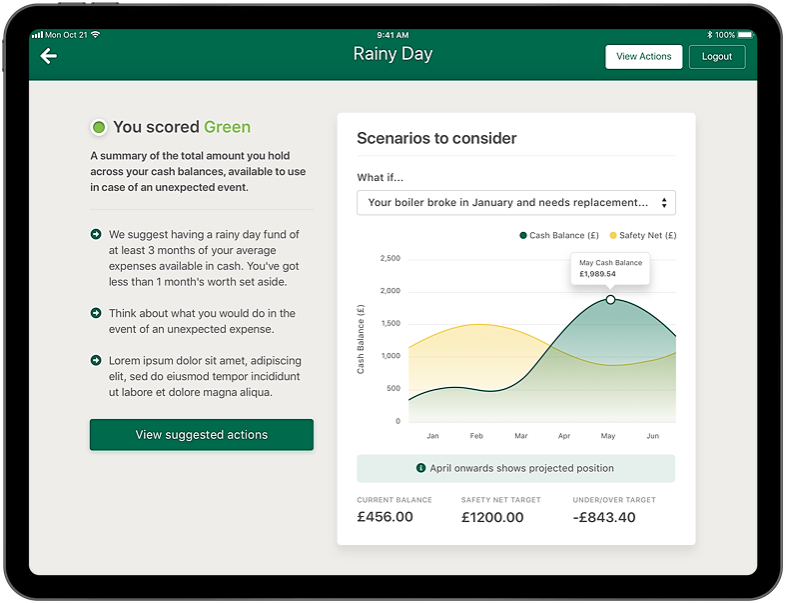
Above: Day to Day screen